
Business Analytical Dashboard
Retail & Analytics Industry
85% faster decision-making through real-time business intelligence
Decision Cycles
Report Prep
Dashboard Adoption
Delivery Context And Business Outcome
Industry
Platform Type
Technology Stack
Duration
Engagement Model
Key Outcome
Client Industry, Timeline, Team, Stack, And Result
Client Industry
Retail & Analytics
Project Timeline
6 Months
Team Size
6 specialists
Tech Stack
Next.js, Apache Kafka, Docker
Headline Result
85% faster decision-making
Problem Statement, Baseline, And Success Criteria
Clear pre-project constraints and measurable targets establish how outcomes are evaluated.
Problem Statement
Sales, marketing, inventory, and customer data existed in silos, making cross-departmental analysis difficult.
Goals And Success Criteria
Where Performance Started Before Delivery
Decision Cycles (Before)
Report Prep (Before)
Dashboard Adoption (Before)
What The Engagement Needed To Deliver
Infinoid partnered with a retail enterprise to build a dynamic business analytical dashboard that transforms raw data into revenue-driving decisions.
From scattered data to streamlined intelligence — Infinoid Technologies Private Limited turns insights into impact.
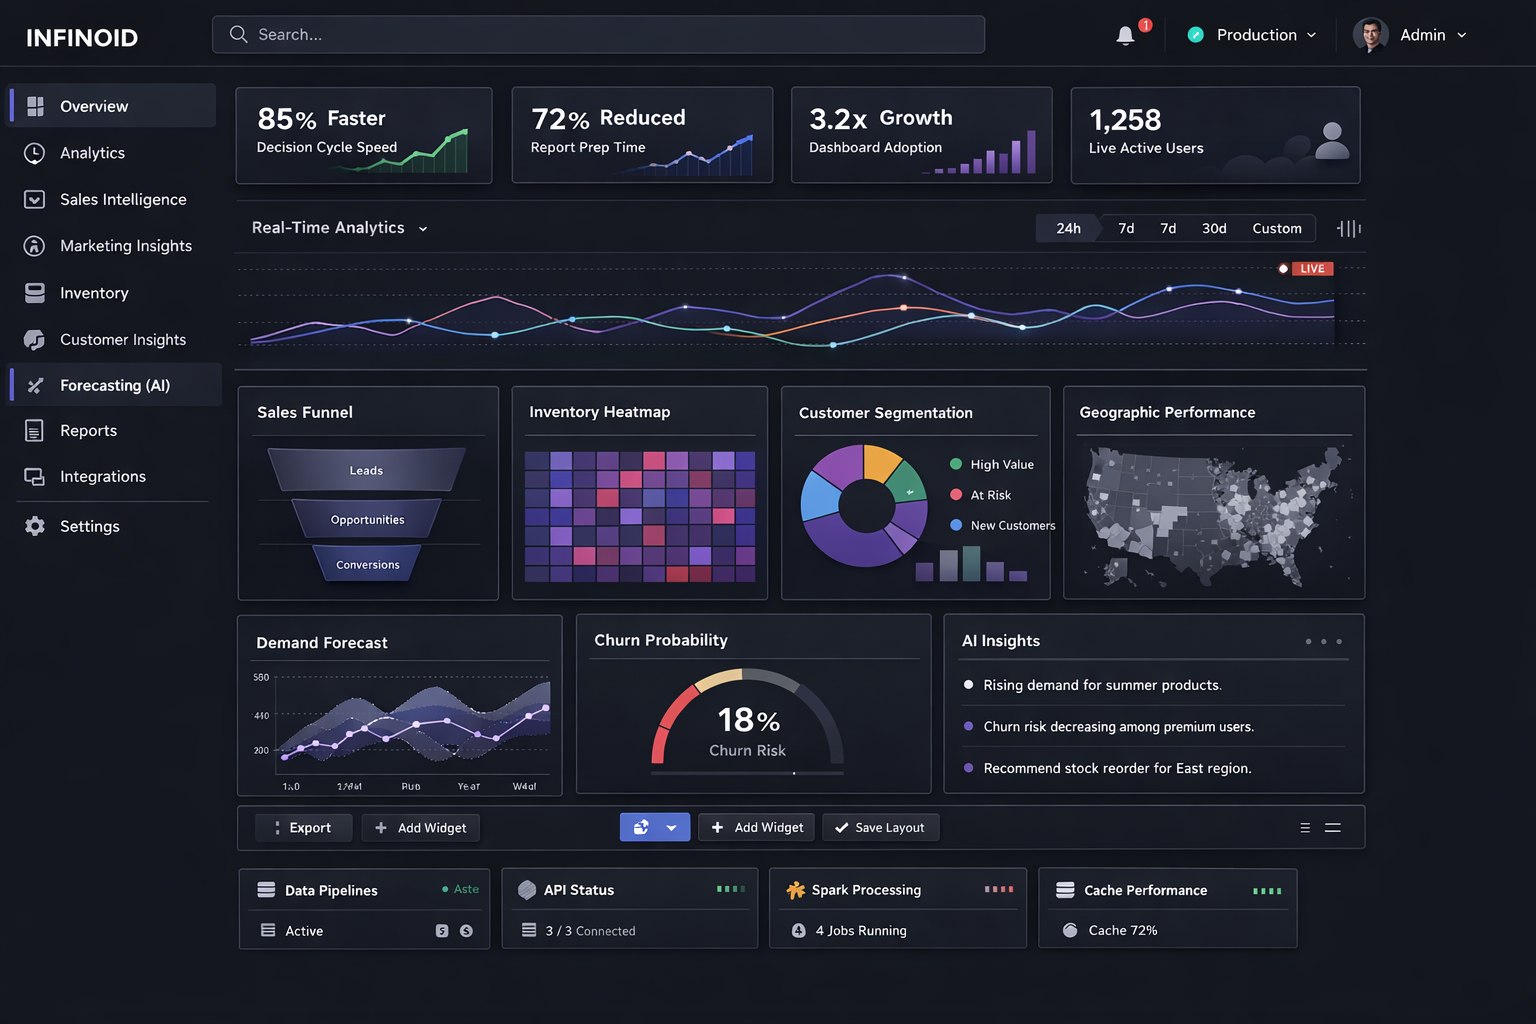
Business analytical dashboard overview
Discovery To Optimization With Duration
Discovery
1-2 weeksStakeholder interviews, baseline audit, and scope alignment.
Design
1-2 weeksUX flows, technical architecture, and sprint planning.
Build
4-8 weeksIncremental feature delivery, integrations, and instrumentation.
QA
1-2 weeksFunctional testing, performance validation, and accessibility checks.
Launch
3-5 daysControlled release, production validation, and monitoring.
Optimization
2-4 weeksPost-launch iteration based on telemetry and user feedback.
How The Product Direction Was Resolved
Fragmented Data Sources
Sales, marketing, inventory, and customer data existed in silos, making cross-departmental analysis difficult.
Lack Of Real-Time Decision-Making
Manual reporting created delays and reduced agility in responding to market changes.
Limited Data Accessibility
Only technical teams could extract insights while business teams were restricted to static reports.
Poor Visualization & Usability
Legacy tools lacked interactivity and mobile compatibility, leading to lower adoption.
Centralized Data Integration using Apache Kafka and Spark
AI-Powered Forecasting Engine for demand and churn analysis
Custom Role-Based Dashboards for tailored KPI views
SEO-Optimized Frontend built with Next.js (App Router)
Mobile-Responsive UX with Dark Mode using Tailwind CSS
Secure and Scalable Backend deployed via Docker and Kubernetes
Why This Approach Was Chosen
Centralized Data Integration Using Apache Kafka And Spark
Tradeoff: Fragmented Data Sources
Rationale: Selected for long-term scalability, maintainability, and stronger business outcomes.
AI-Powered Forecasting Engine For Demand And Churn Analysis
Tradeoff: Lack of Real-Time Decision-Making
Rationale: Selected for long-term scalability, maintainability, and stronger business outcomes.
Custom Role-Based Dashboards For Tailored KPI Views
Tradeoff: Limited Data Accessibility
Rationale: Selected for long-term scalability, maintainability, and stronger business outcomes.
Capabilities Delivered Across The Platform
Data Integration
Data Processing
Visualization Tools
User Interaction
Performance & Deployment
Monitoring & Insights
Tools And Platforms Behind Delivery
Before And After Comparison With Hard Numbers
| Metric | Before | After | Delta |
|---|---|---|---|
| Decision Cycles | 100 index | 15 index | 85% faster |
| Report Prep | 100 index | 28 index | 72% lower |
| Dashboard Adoption | 100 index | 320 index | 3.2x |
Technical Outcomes After Launch
Lighthouse Performance
Core Web Vitals
Accessibility Score
What Set The Delivery Apart
End-To-End Expertise
From data engineering to UI/UX design and deployment, the full stack stayed integrated.
Future-Proof Architecture
The solution was shaped to be scalable, AI-ready, and microservice-friendly for long-term growth.
Data With Design
Intuitive interfaces were paired with strong data foundations to improve adoption across teams.
Speed + Security
The experience stayed fast, responsive, and enterprise-grade without compromising reliability.
Continuous Improvement Opportunities
Expand A/B testing coverage for high-traffic user journeys.
Add deeper event-level analytics for conversion funnels.
Extend automation around regression and accessibility audits.
Next Step
Have A Similar Project?
Let’s transform your data into actionable insights. Build the dashboard your business needs.
Conversion Actions